


Azure Infrastructure: Azure Resource Logging
This document provides an insight into our current reporting and logging capabilities withing our current azure environment. This document aims to detail the tools, configuration and practices we currently in place to monitor, track and manage logs effectively.
Splunk Logging
- I2DB currently has a few resources whose logs are been ingested into Splunk.
- These logs are shipped to Splunk via azure event hub namespaces, click this link to access the i2db-redcapprod namespace.
- This namesspace consist of 4 event hubs:
- i2db-app-svc-logs:
- This Event hub sends all azure app service logs that are in the ICS - Redcap subscription to splunk.
- i2db-appgw-logs:
- This Event hub sends all azure app gateway logs that are in the ICS - Redcap subscription to splunk.
- i2db-database-logs:
- This Event hub sends all MySQL database logs that are in the ICS - Redcap subscription to splunk.
- i2db-vmnic-logs:
- Thisevent hub sends all virtual machine network logs that are in the ICS - Redcap subscription to splunk.
- It is important to note that this event hub will be decommissioned once REDCap is fully migrated to azure app service.
- i2db-app-svc-logs:
- The i2db-rdc-resources was created to ship resources within the i2-rdc2.0 azure poc - dev subscription to splunk.
- However, there only event hub in the namespace is i2db-atlas-appsvc.
- This event hub ships atlas application logs to splunk.
- There are additional event hub namespace that were not set up by the platform engineering team, i believe these were deployed by WuIT to collect logs for WashU gpt resources.
- These event namespaces consist of the following:
Azure Monitor:
- Azure monitor is the primary tool that platform engineering uses for collecting, analyzing, and acting on telemetry from cloud and on-premises environments.
- Within azure monitor, we have what we call Alerts that is used to proactively identify and respond to critical conditions within our azure environment.
- Alerts are usually configured to monitor metrics, activity logs, log alerts and application insights alerts.
- When Alerts are fired & fixed, the details of the alert will appear on the dashboard as follow:
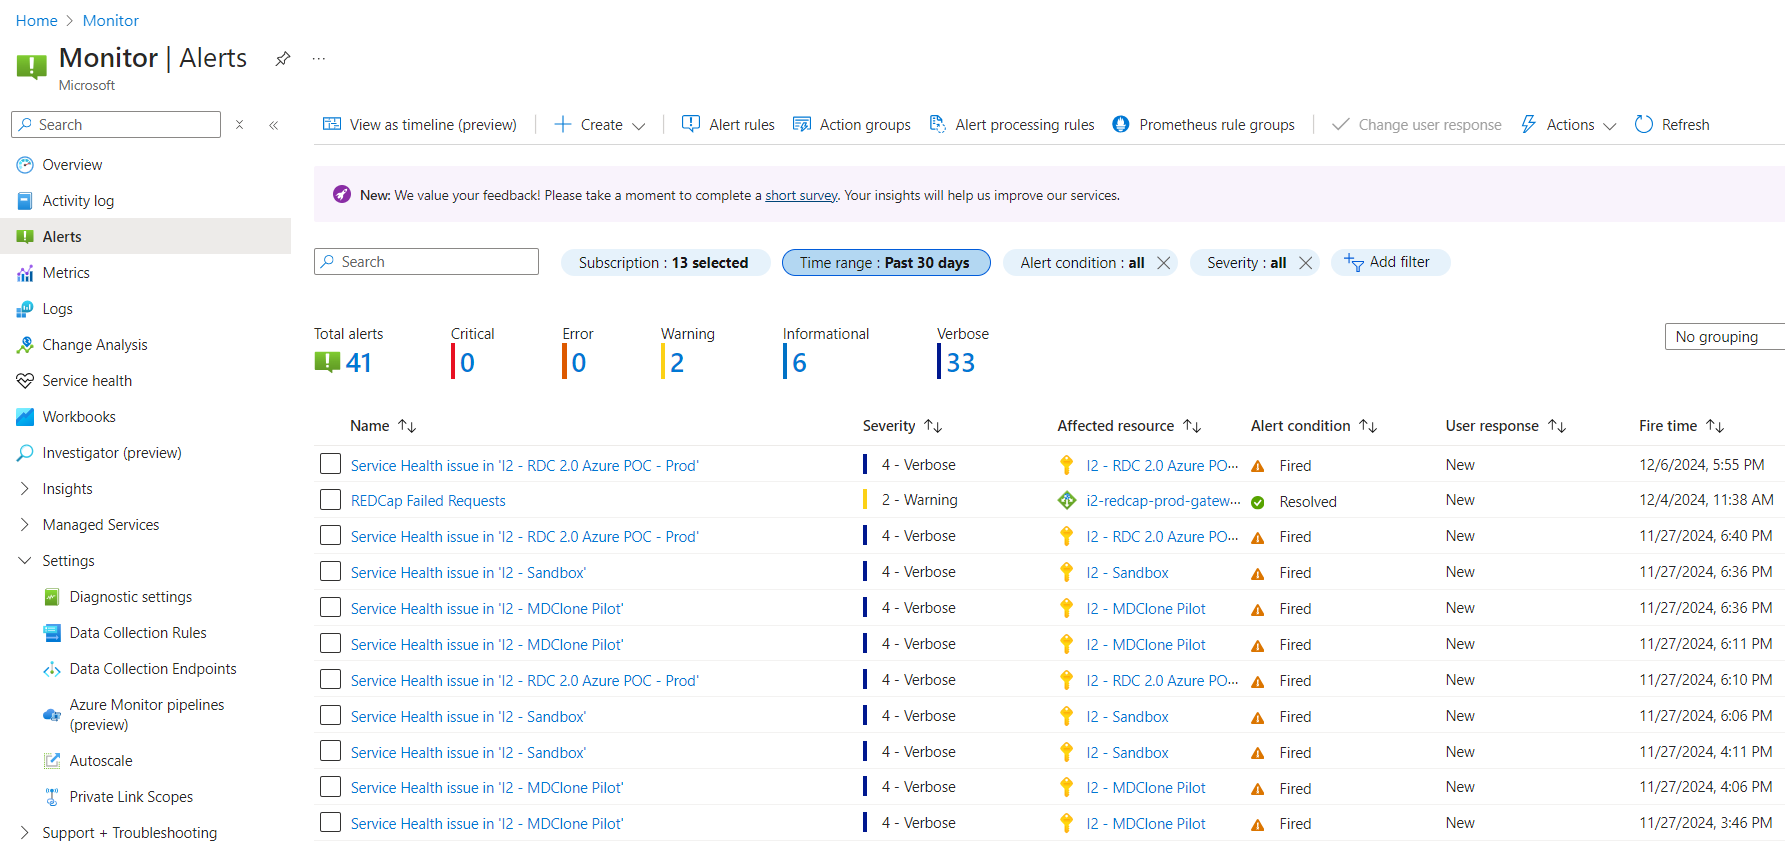
- These alerts are configured using Alert Rules.
- These alerts are then sent out to users using Action Groups.
- These action groups are comprised of user emails that the alerts use to send out emails when an alert is fired or ressolved.
Below are the alert rules categorized by subscriptions and resource types
DI2 - WashU AI Services - Dev subscription:
| Name | Condition | Target resource type | Status |
|---|---|---|---|
| Failure Anomalies - gpt-dev-webapp-appinsights | Failure Anomalies detected | Application Insights | Enabled |
| Failure Anomalies - gpt-quota-func-dev | Failure Anomalies detected | Application Insights | Enabled |
| Failure Anomalies - gpt-quota-tokenizer-func | Failure Anomalies detected | Application Insights | Enabled |
| GPT Dev All Resource Health | Previous resource status=All%2C Current resource status=Degraded and 1 more | All | Enabled |
| GPT Dev App Service Health Alert | HealthCheckStatus < 100 | App Service | Enabled |
DI2 - WashU AI Services - Test subscription:
| Name | Condition | Target resource type | Status |
|---|---|---|---|
| GPT Test All Resource Health | Previous resource status=All%2C Current resource status=Degraded and 1 more | All | Enabled |
| GPT Test App Service Health Alert | HealthCheckStatus < 100 | App Service | Enabled |
I2 - MDClone Pilot subscription:
| Name | Condition | Target resource type | Status |
|---|---|---|---|
| Available Memory Bytes - az-mdc-cw-4 | Available Memory Bytes < 1000000000 | Virtual machine | Enabled |
| Data Disk IOPS Consumed Percentage - az-mdc-cw-4 | Data Disk IOPS Consumed Percentage > 95 | Virtual machine | Enabled |
| Network In Total - az-mdc-cw-4 | Network In Total > 500000000000 | Virtual machine | Enabled |
| Network Out Total - az-mdc-cw-4 | Network Out Total > 200000000000 | Virtual machine | Enabled |
| OS Disk IOPS Consumed Percentage - az-mdc-cw-4 | OS Disk IOPS Consumed Percentage > 95 | Virtual machine | Enabled |
| Percentage CPU - az-mdc-cw-4 | Percentage CPU > 80 | Virtual machine | Enabled |
| Service Health issue in 'I2 - MDClone Pilot' | Service names=All%2C Event types=Service issues | Subscription | Enabled |
| VM Availability - az-mdc-cw-4 | VmAvailabilityMetric < 1 | Virtual machine | Enabled |
I2 - Neurology - Cervical Myelopathy subscription:
| Name | Condition | Target resource type | Status |
|---|---|---|---|
| Failure Anomalies - neuro-cervical-myelopathy-func | Failure Anomalies detected | Application Insights | Enabled |
| Failure Anomalies - neuro-cervical-myelopathy-NodeJS | Failure Anomalies detected | Application Insights | Enabled |
I2 - RDC 2.0 Azure POC - Dev subscription:
| Name | Condition | Target resource type | Status |
|---|---|---|---|
| active-connections | active_connections > 2 | Azure Database for PostgreSQL single server | Enabled |
| Databroker Audit - Function Failed | Table rows > 1 | Application Insights | Enabled |
| Databroker Auditing - No Files Found | Table rows > 1 | Application Insights | Enabled |
| Failure Anomalies - databrokeraudit-import | Failure Anomalies detected | Application Insights | Enabled |
| Failure Anomalies - databrokerauditdbinsights | Failure Anomalies detected | Application Insights | Enabled |
| Failure Anomalies - db-export-tester | Failure Anomalies detected | Application Insights | Enabled |
| i2rdc3-dev-cpu-usage-CRITICAL | Table rows > 0 | Log Analytics workspace | Enabled |
| i2rdc3-dev-cpu-usage-WARN | Table rows > 0 | Log Analytics workspace | Enabled |
| i2rdc3-dev-disk-usage-CRITICAL | Table rows > 0 | Log Analytics workspace | Enabled |
| i2rdc3-dev-disk-usage-WARN | Table rows > 0 | Log Analytics workspace | Enabled |
| i2rdc3-dev-mem-usage-CRITICAL | Table rows > 0 | Log Analytics workspace | Enabled |
| i2rdc3-dev-mem-usage-WARN | Table rows > 0 | Log Analytics workspace | Enabled |
| i2rdc3-dev-pg-connections-WARN | Table rows >= 1 | Log Analytics workspace | Enabled |
| i2rdc3-dev-postgres-ERROR | Table rows > 0 | Log Analytics workspace | Enabled |
I2 - RDC 2.0 Azure POC - Prod subscription:
| Name | Condition | Target resource type | Status |
|---|---|---|---|
| Failure Anomalies - adaptive-file-historian-python | Failure Anomalies detected | Application Insights | Enabled |
| Failure Anomalies - laiazuremlwork4585062429 | Failure Anomalies detected | Application Insights | Enabled |
| Failure Anomalies - wusm-adaptive-historian | Failure Anomalies detected | Application Insights | Enabled |
| GIC App GW Monitor | FailedRequests > 20 | Application gateway | Enabled |
| GIC Mysql Monitor | Category=Administrative | Azure Database for MySQL flexible server | Enabled |
| GIC Server CPU Output | Percentage CPU > 70 | Virtual machine | Enabled |
| GIC_Memory_Monitor | Available Memory Bytes > 25000000000 | Virtual machine | Enabled |
| i2rdc3-prod-cpu-usage-CRITICAL | Table rows > 0 | Log Analytics workspace | Enabled |
| i2rdc3-prod-cpu-usage-WARN | Table rows > 0 | Log Analytics workspace | Enabled |
| i2rdc3-prod-disk-usage-CRITICAL | Table rows > 0 | Log Analytics workspace | Enabled |
| i2rdc3-prod-disk-usage-WARN | Table rows > 0 | Log Analytics workspace | Enabled |
| i2rdc3-prod-mem-usage-CRITICAL | Table rows > 0 | Log Analytics workspace | Enabled |
| i2rdc3-prod-mem-usage-WARN | Table rows > 0 | Log Analytics workspace | Enabled |
| i2rdc3-prod-postgres-ERROR | Table rows > 0 | Log Analytics workspace | Enabled |
| Service Health issue in 'I2 - RDC 2.0 Azure POC - Prod' | Service names=All%2C Event types=Service issues | Subscription | Enabled |
I2 - RDC 2.0 Azure POC - QA subscription:
| Name | Condition | Target resource type | Status |
|---|---|---|---|
| i2rdc3-qa-cpu-usage-CRITICAL | Table rows > 0 | Log Analytics workspace | Enabled |
| i2rdc3-qa-cpu-usage-WARN | Table rows > 0 | Log Analytics workspace | Enabled |
| i2rdc3-qa-disk-usage-CRITICAL | Table rows > 0 | Log Analytics workspace | Enabled |
| i2rdc3-qa-disk-usage-WARN | Table rows > 0 | Log Analytics workspace | Enabled |
| i2rdc3-qa-mem-usage-CRITICAL | Table rows > 0 | Log Analytics workspace | Enabled |
| i2rdc3-qa-mem-usage-WARN | Table rows > 0 | Log Analytics workspace | Enabled |
| i2rdc3-qa-postgres-ERROR | Table rows > 0 | Log Analytics workspace | Enabled |
| Postgres-QA-Memory-Usage | Available Memory Bytes <= 10000000000 | Virtual machine | Enabled |
I2 - Sandbox subscription:
| Name | Condition | Target resource type | Status |
|---|---|---|---|
| Failure Anomalies - billing-i2 | Failure Anomalies detected | Application Insights | Enabled |
| Failure Anomalies - blood-risk-i2-wustl | Failure Anomalies detected | Application Insights | Enabled |
| Failure Anomalies - bpsandboxapi | Failure Anomalies detected | Application Insights | Enabled |
| Failure Anomalies - covid-kiosk-i2-wustl | Failure Anomalies detected | Application Insights | Enabled |
| Failure Anomalies - covid-kiosk-i2-wustl-staging | Failure Anomalies detected | Application Insights | Enabled |
| Failure Anomalies - covid-order-kiosk-i2-wustl | Failure Anomalies detected | Application Insights | Enabled |
| Failure Anomalies - covid19-i2-wustl | Failure Anomalies detected | Application Insights | Enabled |
| Failure Anomalies - covid19score | Failure Anomalies detected | Application Insights | Enabled |
| Failure Anomalies - devops-shields | Failure Anomalies detected | Application Insights | Enabled |
| Failure Anomalies - i2db-pe-tickets | Failure Anomalies detected | Application Insights | Enabled |
| Failure Anomalies - neph-calc-i2-wustl | Failure Anomalies detected | Application Insights | Enabled |
| Failure Anomalies - RDScore | Failure Anomalies detected | Application Insights | Enabled |
| Failure Anomalies - sense-i2 | Failure Anomalies detected | Application Insights | Enabled |
| Failure Anomalies - study-search-funcs-i2 | Failure Anomalies detected | Application Insights | Enabled |
| Failure Anomalies - study-search-web-i2 | Failure Anomalies detected | Application Insights | Enabled |
| Failure Anomalies - WYSAHealthMonitor | Failure Anomalies detected | Application Insights | Enabled |
| Service Health issue in 'I2 - Sandbox' | Service names=All%2C Event types=Service issues | Subscription | Enabled |
| study-search-availability-test-study-search-web-i2 | Failed locations >= 2 | Application Insights | Enabled |
ICS - Redcap subscription:
| Name | Condition | Target resource type | Status |
|---|---|---|---|
| Available Memory Bytes - i2-redcap-prod-web-vm-01 | Available Memory Bytes < 1000000000 | Virtual machine | Enabled |
| Data Disk IOPS Consumed Percentage - i2-redcap-prod-web-vm-01 | Data Disk IOPS Consumed Percentage > 95 | Virtual machine | Enabled |
| Failure Anomalies - i2-redcap-app-test | Failure Anomalies detected | Application Insights | Enabled |
| Failure Anomalies - i2-redcap-qa-web | Failure Anomalies detected | Application Insights | Enabled |
| Failure Anomalies - i2-redcap-qa-web-appInsight | Failure Anomalies detected | Application Insights | Enabled |
| MySQL IO Warning | io_consumption_percent > 65 | Azure Database for MySQL single server | Enabled |
| Network In Total - i2-redcap-prod-web-vm-01 | Network In Total > 500000000000 | Virtual machine | Enabled |
| Network Out Total - i2-redcap-prod-web-vm-01 | Network Out Total > 200000000000 | Virtual machine | Enabled |
| OS Disk IOPS Consumed Percentage - i2-redcap-prod-web-vm-01 | OS Disk IOPS Consumed Percentage > 95 | Virtual machine | Enabled |
| Percentage CPU - i2-redcap-prod-web-vm-01 | Percentage CPU > 80 | Virtual machine | Enabled |
| rdc_Adminstrative_Actions | Category=Administrative | Azure Database for MySQL flexible server | Enabled |
| REDCap backend down | HealthyHostCount < 1 | Application gateway | Enabled |
| REDCap Failed Requests | FailedRequests > 7 | Application gateway | Enabled |
| REDCap Prod VM Low Mem Alert | Available Memory Bytes <= 32000000000 | Virtual machine | Enabled |
| Redcap_MySQl_Admin_Actions | Category=Administrative | Azure Database for MySQL flexible server | Enabled |
| Redcap_VM_CPU_Utilization | Percentage CPU > 60 | Virtual machine | Enabled |
Budgets
- It is a service that helps track our spending and can alert us when our cost exceeds a threshold.
- As it stands, we currently have a budget set up for every subscription within our environemnt except the WashU AI Services subscriptions.
- These budgets are as follows:
I2 - Biostatistics
- To access the budget for this subscription click biostatistics-monthly-cost
I2 - MDClone Pilot:
- To access the budget for this subscription click mdclone-subscription
I2 - Neurology - Cervical Myelopathy
- To access the budget for this subscription click Monthly-Neurology-Budget
I2 - RDC 2.0 Azure POC - Dev
- To access the budget for this subscription click Monthly-RDC-dev-Budget
I2 - RDC 2.0 Azure POC - Prod
- To access the budget for this subscription click Monthly-RDC-Prod-Budget
I2 - RDC 2.0 Azure POC - QA
- To access the budget for this subscription click Monthly-RDC-QA-Budget
I2 - Sandbox
- To access the budget for this subscription click sandbox-subscription
ICS - Redcap
- To access the budget for this subscription click ics-redcap-subscription
Pediatrics - PEDScreen
- To access the budget for this subscription click Monthly-Pediatrics-PEDScreen-Budget
Pediatrics - Sisk Novel Chatbots
- To access the budget for this subscription click Monthly-Pediatrics-subscription